Riding the Rails: Trendlines & Price Channels
Trendlines are the market’s railway tracks 🚂-they show you where price has been and where it might stop for a breather. Draw two, make them parallel, and voilà: you’ve built a price channel that maps the train’s full route.
Uptrend Line
Connect at least two higher lows. Price should respect that line like a polite commuter-bouncing off it instead of crashing through.
- Use a log scale on higher-timeframes to be precise.
- The more touches, the stronger the line.
Downtrend Line
Same rules, flipped: link at least two lower highs. A break and close above can be an early hint the bears are dozing off.
From Line to Lane: Price Channels
Once you have a trendline, copy-paste it (Ctrl/Cmd + Drag in TradingView) and drop the clone on the opposite side of price action. Congrats-you’ve boxed price inside its own playground.
| Channel Type | Slope | Common Use-Case |
|---|---|---|
| Ascending | Upward ↗︎ | Ride pullbacks in a bull trend. |
| Descending | Downward ↘︎ | Short rallies in a bear move. |
| Rectangle | Flat ➖ | Breakout traders’ favourite squeeze box. |
Zoom Out First
Start on the daily or 4-hour to catch the grand slope, then drop to lower timeframes for sniper entries.
Wicks vs. Bodies
No holy rule-experiment. Many pros use body-closes for clarity, but include major wicks if they keep reappearing.
Don’t Force It
If you’re tilting the chart just to make points connect, it’s probably not a valid line. Let price volunteer the evidence.
Visual Cheat-Sheet
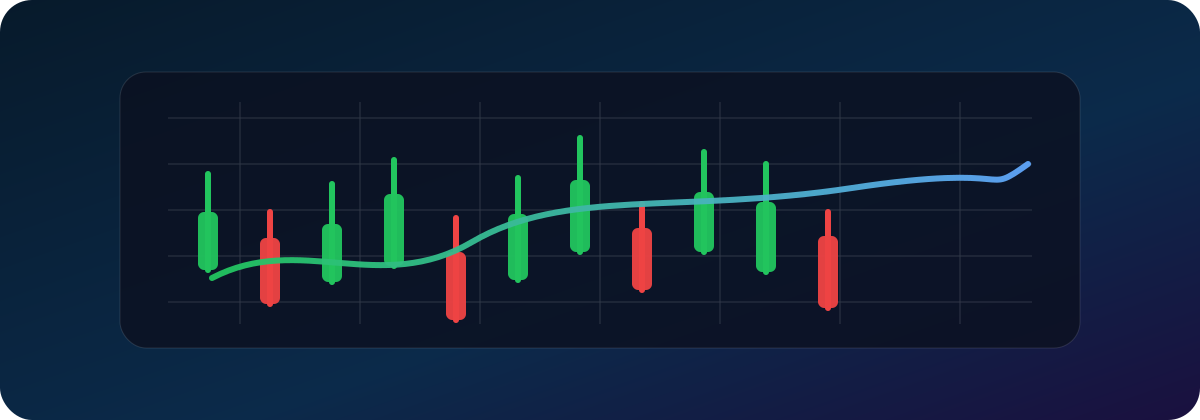
Parallel lines = a tidy uptrend channel. Notice those respectful touches? Chef’s kiss.
Pro nugget: a channel break isn’t a signal by itself-wait for a retest or confluence (e.g., support / resistance level, moving average) to avoid fake-out Fridays. 📉📈