
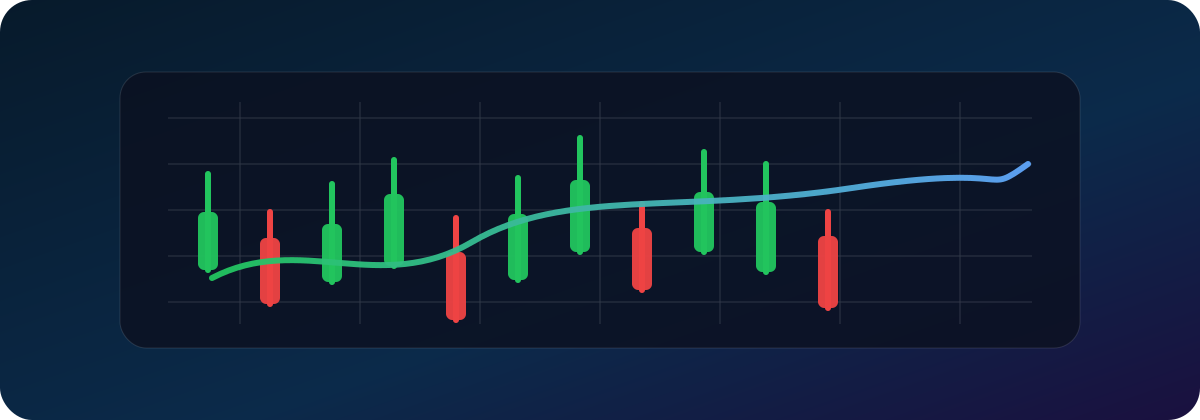
Making Sense of Moving Averages
Moving averages (MAs) are the Swiss-Army knife 🔪 of chart analysis-they smooth price noise, highlight trend direction, and even spit out trading signals. Let’s unpack how they work and, more importantly, how to use them rather than just plot rainbow spaghetti all over your chart.
Simple Moving Average (SMA)
The arithmetic mean of the last n closes. Example: a 50-period SMA sums the previous 50 closing prices and divides by 50.
SMAn = (P₁ + P₂ + … + Pₙ) ⁄ nExponential Moving Average (EMA)
Gives more weight to recent prices, so it reacts faster to change. Traders love the 9 & 21 EMAs for spotting momentum shifts.
EMAt = Pt × k + EMAt-1 × (1 − k)
where k = 2 ⁄ (n + 1)
SMA vs. EMA at a Glance
| Property | SMA | EMA |
|---|---|---|
| Responsiveness | Slower, smoother | Faster, more sensitive |
| Lag | Higher | Lower |
| Noise filter | Great for broad trend | Great for entries/exits |
Golden / Death Cross
When the 50-SMA crosses the 200-SMA upward, bulls cheer (Golden Cross 🥇). The opposite is the Death Cross 💀. Works better on higher timeframes (H4, Daily) to filter whipsaws.
Fast/Slow EMA Crossover
Day-traders often pair 9 & 21 EMAs:
• 9 crosses above 21 → potential long
• 9 crosses below 21 → potential short
How to Make MAs Work for You
- Match the period to your timeframe. Swing traders love 50 & 200; scalpers lean on 8 & 21.
- Combine with structure. An MA bounce off support carries more weight than a random touch mid-range.
- Beware of ranging markets. MAs flatten and give false signals-use RSI or ATR to confirm volatility first.
- Journal everything in Tracom: note which MA settings align best with your pair and style.
DIY EMA Example (5-Period)
Say the last 5 closes on EUR/USD (hourly) were: 1.0920, 1.0935, 1.0940, 1.0948, 1.0955.
k = 2 ⁄ (5 + 1) = 0.333
EMAtoday = 1.0955 × 0.333 + EMAyesterday × 0.667
Plug yesterday’s EMA, rinse and repeat. Your platform does this automagically, but it’s nice to know the math under the hood!