Reading Price Stories with Candlestick Patterns
Candles are like emojis for price action 😎-each one tells a mini-story about who won the last battle between bulls and bears. Learn to recognise the shapes below and you’ll decode market mood at a glance.
Anatomy of a Candle
- Body – open → close. Wide body = strong move.
- Wick / Shadow – price explored but rejected.
- Colour – up (move) vs. down (move), depends on platform theme.
Quick read: long lower wick = buyers punched back; long upper wick = sellers pushed down.
Single-Bar Signals 🕯️
Hammer & Shooting Star
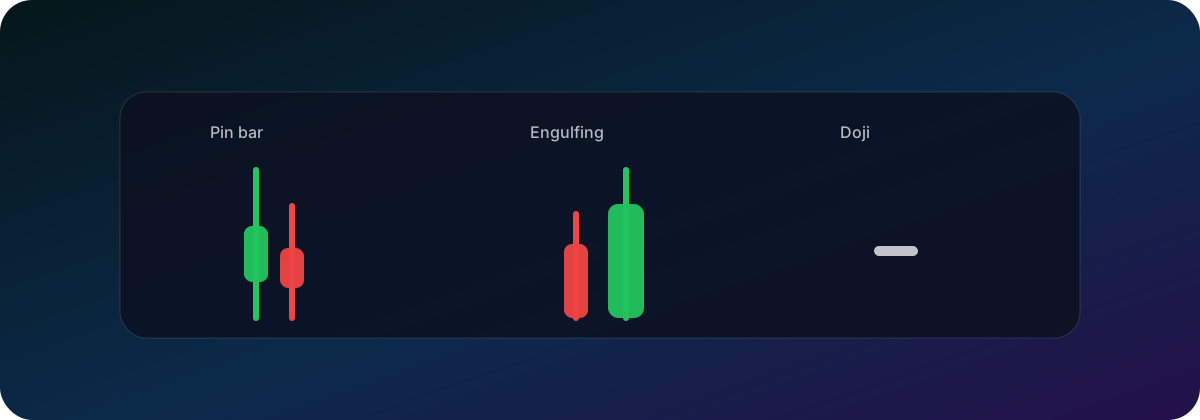
Long lower wick at support = hammer (bullish). Long upper wick at resistance = shooting star (bearish).
Open   Close
  │     │
  │     │
┌─┴─────┴─┐
│         │   ← body
└─────────┘
│         │   ← long wick
Bullish / Bearish Engulfing
A full-bodied candle swallows the prior one. Bullish engulfing after a dip often kick-starts reversals.
Doji
Open ≈ Close → indecision. Wait for the next bar to confirm direction.
Inside Bar
Whole candle sits within previous high-low range. Think of it as a spring coiling-breakout can pop either way.
Multi-Bar Patterns 📚
Morning & Evening Star
Three-candle combo: big body ➜ small indecision ➜ big opposite body. Morning star = bullish; evening star = bearish.
Three White Soldiers & Three Black Crows
Three consecutive strong candles in one direction. Signals powerful momentum… but beware of overextension.
Putting It All Together
- Confirm patterns at key levels (support, resistance, fibs).
- Higher timeframe context > lower timeframe noise.
- Add volume, RSI or structure breaks for extra confluence.
Challenge: screenshot the next hammer you spot, log it in Tracom, and tag notes on whether price really followed through. Patterns + journaling = edge! 📝